The four GDP graphs that show us roaring out of recession pre-lockdown
- Written by Peter Martin, Visiting Fellow, Crawford School of Public Policy, Australian National University

Back in the first three months of this year when we had JobKeeper, enhanced unemployment benefits and no lockdowns, Australia roared out of recession.
The GDP figures released on Wednesday tell us that in the months leading up to the end of JobKeeper and the coronavirus supplement at the end of March Australians spent, earned and produced an impressive 1.8%[1] more than in three months to December, which was itself more 3.2% more than the three months to September, which was itself 3.5% more than the three months before that.
It’s growth of more than 8%, described by Treasurer Josh Frydenberg as the most over three quarters since 1968.
But it followed a collapse in gross domestic product of 7% – by far the worst since the Bureau of Statistics began compiling records in 1959.
The net result over the year to March growth of 1.1%, an extraordinary result which means that, at least until Victoria’s (just extended) lockdown, we were producing, earning and spending more than before the COVID recession.
On the graph it’s not much more, not the two or so per cent of normal growth the Reserve Bank had been expecting before the recession, but it means that almost alone among developed nations (along with South Korea and probably New Zealand whose figures aren’t yet out) we are better off after the COVID recession than before it.
Australian quarterly gross domestic product
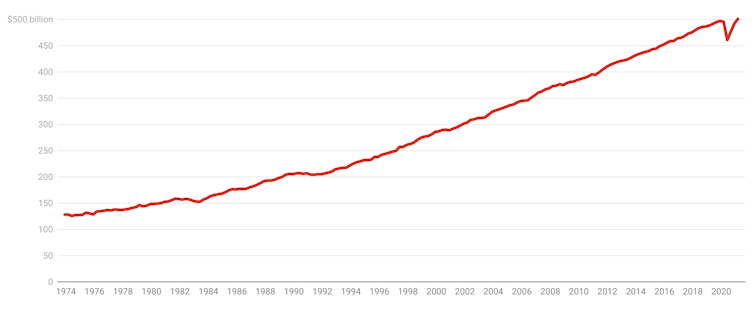 Chain volume measures, seasonally adjusted. ABS[2]
And we are better off than that bald GDP figures suggest.
In accordance with what is normally good statistical practice those figures are adjusted down for upward movements in prices.
We’ve had a monster upward movement in the price of iron ore over the past year which has enriched Australians through channels including company profits, tax revenue and a higher dollar that aren’t fully reflected in gross domestic product.
That’s why the bureau publishes a separate measure that measures buying power called real national disposable income per capita.
The graph shows it has climbed well above where it was to a new record high.
We ended the recession with 5.8% more buying power than before it began.
Real national disposable income per capita
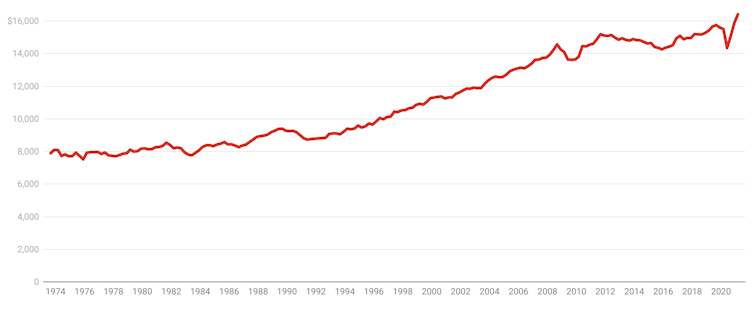 Chain volume measures, seasonally adjusted. ABS[3]
But we’ve been reluctant to fully use that buying power.
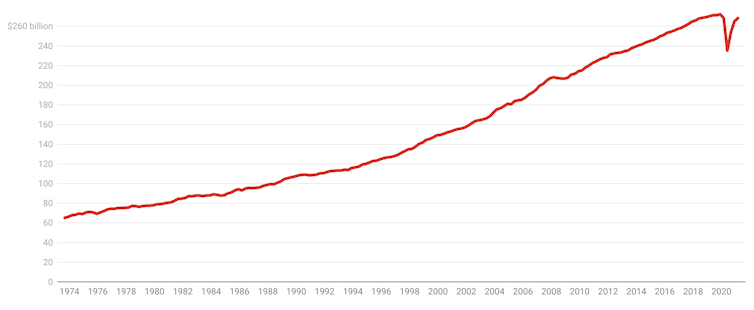
While consumer spending has bounced back to where it was before the recession, in terms of what it buys it is no higher.
In March 2021 we were buying no more than we were in March 2020 — more goods, less services, and more essential items, fewer discretionary items, but no more than we did a year earlier.
Zero growth in buying at a time of substantial growth in buying power can be seen as either disturbing, a sign of understandable caution, or a sign that the best is yet to come.
Household final consumption expenditure
 Chain volume measures, seasonally adjusted. ABS[4]
At his press conference Frydenberg painted the caution to date as something that would support economic growth in the months to come as we unwind our record-high household saving rate.
But the unwinding slowed in the three months to March.
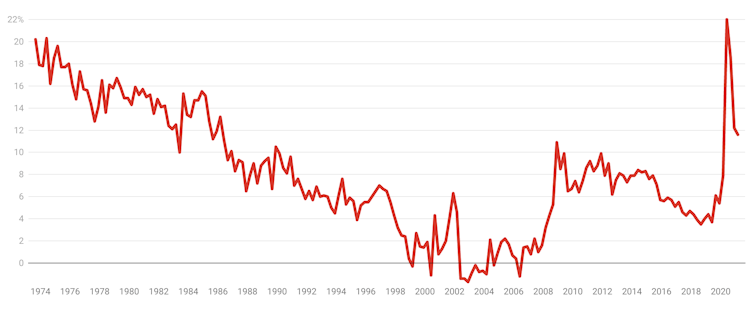
In the December quarter the saving rate plunged from 18.6% of after tax income to 12.2%. Before that it had plunged from the record-high 22% to 18.6%.
But in the March quarter it barely fell, inching down from 12.2% to 11.6%, perhaps reflecting the imminent end of JobSeeker and the coronavirus supplement.
Household saving ratio
 Ratio of saving to net-of-tax income, seasonally adjusted. ABS[5]
The subsequent spread of coronavirus in Victoria, and the reluctance[6] to date of the federal government to reinstate JobKeeper in Victoria will give Australians to keep saving rather than spending their money for some time to come.
Frydenberg told the national accounts press conference he was open to further assistance of another kind and would speak to Victoria’s Treasurer as soon as he could.
Read more: Frydenberg spends the bounty to drive unemployment to new lows[7]
Business investment in buildings and equipment surged 5.3% in the March quarter (enough to account for nearly all of the economic growth over the past year) aided by investment incentives which were renewed in the May budget.
Australia’s rigorous approach to compiling the national accounts means the ones released Wednesday are out of date.
Although much will have improved since then, the spread of coronavirus and the lockdown in Victoria means much is suddenly worse.
Our future is about as uncertain as it has ever been.
References
Authors: Peter Martin, Visiting Fellow, Crawford School of Public Policy, Australian National University


