The Bulletin
The Times


.

6 graphs that explain the economy

  • Written by John Hawkins, Senior Lecturer, Canberra School of Politics, Economics and Society and NATSEM, University of Canberra
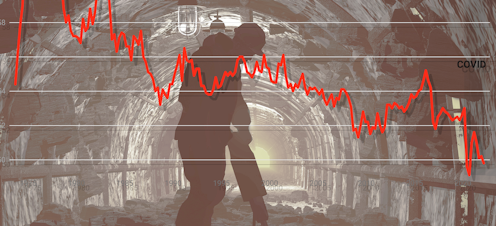
6 graphs that explain the economyShutterstock

Australia’s economy edged closer back towards normal in the three months to March, growing by 0.8% in the quarter (which is towards the upper end of economic growth before COVID hit in early 2020) and 3.3% over the year to the March (which is somewhat higher than before the pandemic).

The economy is now 4.5% bigger than before the...

Read more: 6 graphs that explain the economy

hacklink hack forum hacklink film izle hacklink Tuloskeskusjojobetjojobetcasibomjojobetesim balkancasibom girişgrandpashabet girişwww.jmctpolytechnic.orgbetparkbetparkonline casinoonline casinoonline casinoonline casinoonline casinoonline casinoonline casinoonline casinoonline casinoonline casinoonline casinoonline casinoonline casinoonline casinoonline casinoonline casinoonline casinoonline casinoonline casinoonline casinoonline casinoonline casinoonline casinoonline casinoonline pokieGalabetThe Pokies casinoplay pokies onlineonline pokiesbest pokies sitesThe Pokies reviewalykellomiehelle.comThe Pokies bonusRoyal reelsAustralian pokiesreal money pokiesz-libGalabetplay Royal ReelsRoyal Reels pokiesRoyal Reels pokiesRoyal Reels loginBoss Rummycasinos not on gamstopnon gamstop casinos ukcasinos not on gamstopnon gamstop casinojojobetcasinos not on gamstoponline gamblingbest casinos not on gamstopgambling sites not on gamstopgambling sites not on gamstopjojobetjojobet girişjojobet girişnakitbahis