Drought and climate change are driving high water prices in the Murray-Darling Basin
- Written by Neal Hughes, Senior Economist, Australian Bureau of Agricultural and Resource Economics and Sciences (ABARES)
Water prices in the southern Murray-Darling Basin have reached their highest levels since the worst of the Millennium drought[1] more than a decade ago. These high water prices are causing much anxiety in the region, and have led the federal government to call on the Australian Competition and Consumer Commission to hold an inquiry[2] into the water market.
Inevitably, whenever an important good becomes more expensive – be it housing, electricity or water – there is a rush to identify potential causes and culprits. In the past few years high water prices have been blamed on foreign investors[3], corporate speculators[4], state government water-sharing rules[5], new almond plantings[6] and the Murray-Darling Basin Plan[7].
Read more: The Murray-Darling Basin scandal: economists have seen it coming for decades[8]
While some of these factors have had an effect on the market, they are in many ways a distraction from the simpler truth: that high water prices have mostly been caused by a lack of rain.
Supply drives the market
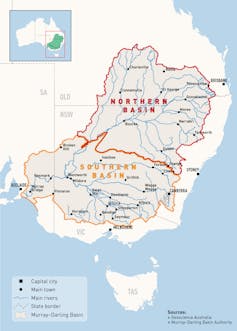 The waters of the northern basin run to the Darling River and the waters of the southern basin run to the Murray River.
MDBA[9]
Market reforms in the 1980s and 1990s[10] enabled water trading in many parts of Australia. By far the most active market exists in the southern Murray-Darling basin, which covers the Murray River and its tributaries in northern Victoria, southern New South Wales and eastern South Australia.
The market allows users – mostly irrigation farmers – to trade their water allocations (effectively shares of water in the rivers’ major dams). This trading helps ensure limited water supplies go to the farmers who value them the most, which can be crucial in times of drought.
Historical data shows the main driver of water market prices in the southern basin is change in water supply[11].
The following chart shows storage volumes (in orange) and water prices (in red) in the southern basin since 2006. Prices peaked at the height of the Millennium drought in 2007. During the floods of 2011, they fell near zero. Prices have increased again during the latest drought, and are now at their highest levels in a decade.
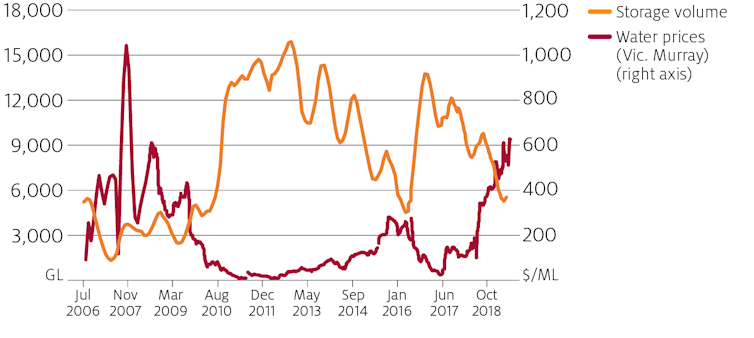 Water allocation prices and storage volumes in the southern Murray-Darling Basin.
State government trade registers, BOM, Ruralco Water, ABARES estimates.
Lower rainfall, higher temperatures
While water prices have always been higher in dry years and lower in wet, we’ve been getting a lot more dry years in recent decades.
Over the past 20 years, rainfall, run-off and stream flow in the southern basin has been far less than historical conditions.
The below chart shows modelled flow data for the Murray River, assuming historical weather conditions and no water extraction, over the past century. It shows that average water flows this century are about 40% below the average of the 20th century.
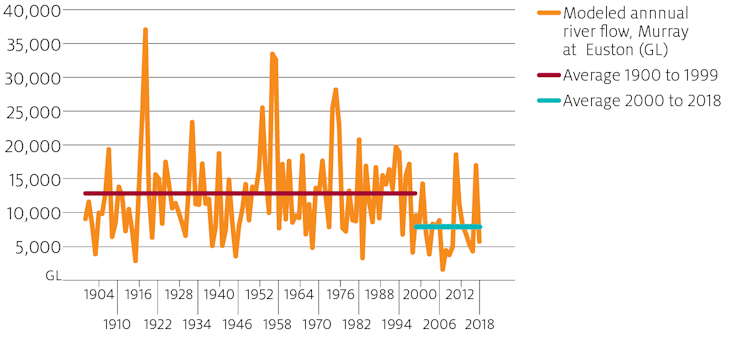 Modelled ‘without-development’ annual Murray River flow, 1900 to 2018.
Murray-Darling Basin Authority.
We know these reductions are at least partly related to climate change[12], driven by both reduced winter rainfall and higher temperatures[13].
Lower rainfall and higher temperatures also make crops thirstier, increasing demand for irrigation water. This was evident in January, when temperatures exceeded 35℃ for 14 days[14] and irrigators’ demand for water spiked from about 4.5 gigalitres to 7 gigalitres a day.
Read more: Droughts, extreme weather and empowered consumers mean tough choices for farmers[15]
The basin plan in perspective
The Murray-Darling Basin Plan seeks to improve the environmental health of the river system by recovering water rights from irrigation farmers. To date, more than 1,700 gigalitres [16] of water rights – about 20% of annual water supply – have been recovered in the southern basin.
By reducing supply, water recovery was always expected[17] to increase water prices. However, the effects of water recovery on supply – while significant – are still small relative to the effects of climate over the same period, as shown in the below chart.
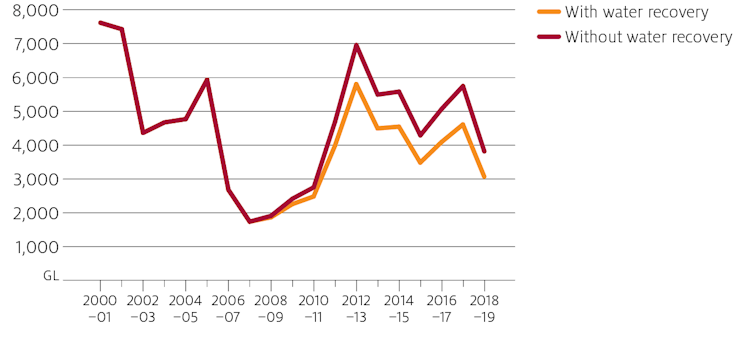 Water allocation use in the southern basin with and without water recovery.
State government agencies, Department of Agriculture, ABARES estimates.
Measuring the precise effect of water recovery on prices is difficult. Water buybacks are straightforward and have been modelled by ABARES[18] and others[19]. But the effects of infrastructure programs – where farmers return a portion of their water rights in exchange for funding to upgrade infrastructure – are harder to estimate[20].
Read more: Billions spent on Murray-Darling water infrastructure: here's the result[21]
‘Carryover’ rule changes
Historically farmers had to use water allocations within a 12-month window. The introduction of “carryover[22]” – most recently in Victoria in 2008 – means users can now hold their unused water in dams. This rule change was a good thing, as it encourages farmers to conserve water and build up a buffer against drought.
But it might also have contributed to anxiety about the water market’s operations.
Since water allocations can be bought and held for multiple years, information about future conditions can have a big effect on prices now. For example, we see large jumps in price following news of worse-than-expected supply forecasts[23]. This may have helped fuel concern about “speculators”.
Over the longer-term, the ability to store water helps to “smooth” water prices[24], with slightly higher prices in most years offset by much lower prices in drought years. Again this is a good thing, but it may have added to the perception of higher prices in the market.
Water demand is rising
When a profitable new irrigation activity is willing to pay more for water – as is the case with almond farms in the southern basin[25] – competition for limited supplies can potentially drive up prices.
ABARES’ research shows that between 2003 and 2016[26] there was little change in irrigation demand (aside from that linked to rainfall). Growth in demand from expanding activities such as almonds and cotton was offset by reductions in others including dairy, rice and wine grapes. However, there is evidence since 2016 that demand for water has started to increase, contributing to higher water prices[27]. Longer-term projections suggest this trend may continue[28].
With drought and climate change reducing water supply, and demand for both environmental and irrigation water increasing, high water prices are only likely to become more common in the basin in future.
References
- ^ Millennium drought (www.bom.gov.au)
- ^ an inquiry (www.abc.net.au)
- ^ foreign investors (www.abc.net.au)
- ^ corporate speculators (www.theguardian.com)
- ^ state government water-sharing rules (www.abc.net.au)
- ^ new almond plantings (www.afr.com)
- ^ Murray-Darling Basin Plan (amp.abc.net.au)
- ^ The Murray-Darling Basin scandal: economists have seen it coming for decades (theconversation.com)
- ^ MDBA (www.mdba.gov.au)
- ^ in the 1980s and 1990s (www.agriculture.gov.au)
- ^ change in water supply (www.agriculture.gov.au)
- ^ related to climate change (www.seaci.org)
- ^ reduced winter rainfall and higher temperatures (www.mssanz.org.au)
- ^ exceeded 35℃ for 14 days (www.weeklytimesnow.com.au)
- ^ Droughts, extreme weather and empowered consumers mean tough choices for farmers (theconversation.com)
- ^ 1,700 gigalitres (www.agriculture.gov.au)
- ^ always expected (data.daff.gov.au)
- ^ ABARES (data.daff.gov.au)
- ^ others (www.agriculture.gov.au)
- ^ are harder to estimate (data.daff.gov.au)
- ^ Billions spent on Murray-Darling water infrastructure: here's the result (theconversation.com)
- ^ carryover (data.daff.gov.au)
- ^ supply forecasts (www.weeklytimesnow.com.au)
- ^ “smooth” water prices (www.agriculture.gov.au)
- ^ almond farms in the southern basin (www.theguardian.com)
- ^ between 2003 and 2016 (www.agriculture.gov.au)
- ^ contributing to higher water prices (www.agriculture.gov.au)
- ^ may continue (waterregister.vic.gov.au)
Authors: Neal Hughes, Senior Economist, Australian Bureau of Agricultural and Resource Economics and Sciences (ABARES)


