The S&P 500 nears its all-time high. Here's why stock markets are defying economic reality
- Written by James Doran, Associate professor/Deputy head of school, UNSW
The stock market is not the economy.
This old and playful maxim is typically not true: often the stock market is a good proxy for the economy and a very good indication of what will happen to it.
But it aptly captures the current divergence between stock markets and the worst economic crisis in a century.
In the United States the NASDAQ (which include tech stocks such as Amazon, Apple, eBay, Microsoft and Google’s parent company Alphabet Inc) is now 10% higher than before COVID-19 fears crashed global markets between late February and late March.
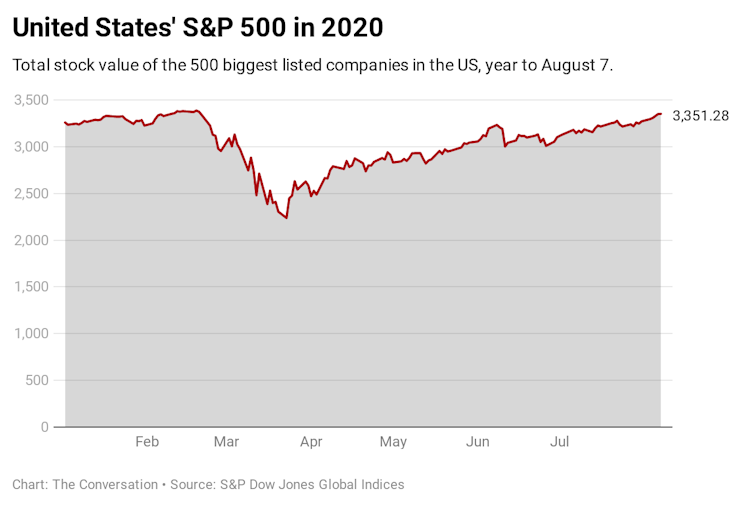
The benchmark S&P 500 index[1] is now on the verge of an all-time high. Last week it closed at 3,349 points, just 1% lower than its February 19 high of 3,386.
 CC BY-SA[2]
Compare this reversal of fotune to the S&P 500’s trajectory after the Global Financial Crisis of 2007-8. Then it took about five years for the index to claw back its losses.
And this despite the US economy now being in a much worse position than during the GFC, with an unemployment rate of more than 10%[3], a muddled federal government response and Congress unable to agree on a new economic stimulus package.
Read more:
Will the GOP let Congress send money to states and cities reeling from the pandemic? 4 essential reads on the economic crisis[4]
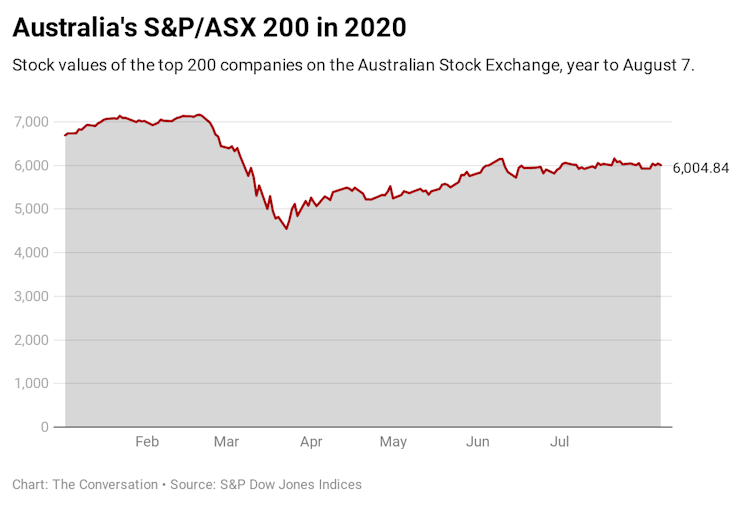
Other national stock markets have had similar if less exuberant rebounds. From their pre-COVID highs, Britain’s FTSE 100 is still down about 20%, Japan’s Nikkei 225 about 6.5% and Australia’s S&P/ASX 200 index about 15%. Nonetheless their recoveries are still remarkable.
 CC BY-SA[5]
The least worst best
Normally stock markets tell us a lot about the economy. Buying and selling shares is a near-instant response to new information. The aggregation of those best guesses is generally an accurate indicator of the way things are going.
This time there might be a structural reason why the markets appear divorced from reality.
Investors could be bidding up stock prices because they have to put their money somewhere, and stocks are the least worst bet.
Read more:
Blue-chip, volatile, high-risk: retail investors are buying while professionals are selling[6]
Broadly speaking, investors can put money to work in five places: stocks; property; commodities; bonds or money in the bank.
Property investment has become extremely risky. Values remain high due to temporary support schemes, and significant falls are likely.
Commodities are generic tradeable items such as oil, wheat and coffee beans.
Like all tradeable items, their prices rise and fall, and the pandemic has been driving them down. In April the World Bank’s Commodity Markets Outlook[7] warned the risks to forecasts were “large in both directions”.
Bonds are paying less and less
What about bonds[8] – the ultrasafe investment offered by governments?
Their attractiveness depends on the interest they pay, and that depends on expectations[9] about interest rates and inflation.
Both were going downhill before the pandemic, and COVID-19 has pushed them down further. In March the US Federal Reserve cut its interest-rate target range to 0-0.25%[10]. The Reserve Bank of Australia cut its target to 0.25%[11] but has in practice[12] been prepared to accept a cash rate closer to zero[13].
Read more:
The government has just sold $15 billion of 31-year bonds. But what actually is a bond?[14]
The interest rates that influence bonds also affect returns on bank deposits.
That leaves stocks.
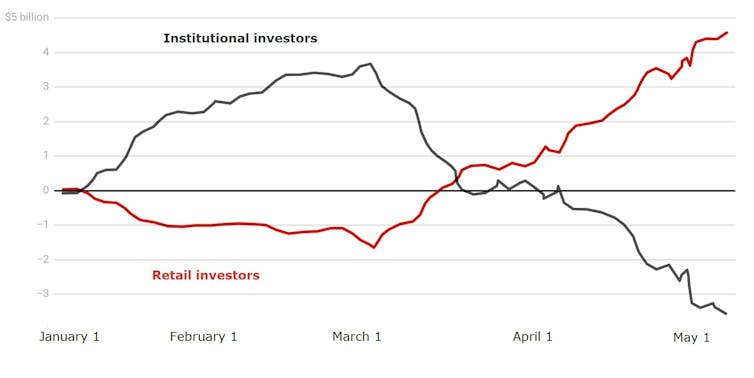
A notable feature of the stock market’s buoyancy has been the influx of retail (at the expense of professional or institutional) investors.
Since the market peaked in late February they have become net buyers of stocks, while professional institutional investors have become net sellers.
Cumulative net buying (A$ billion)
 S&P/ASX 300, January to mid-May 2020.
Author's calculations
Researchers Carole Comerton-Forde and Zhou Zhong suggest this might be due to people having fewer other spending opportunities[15], and more time on their hands – the so-called boredom markets hypothesis[16].
Governments have helped with programs to prop up businesses, among them the US$659 billion Paycheck Protection Program[17] and Australia’s A$86 bllion JobKeeper[18] and A$40 billion Coronavirus Small and Medium Enterprises Guarantee[19] programs.
In April and May this year Australian government spending jumped 11%[20] on the same months last year. In April, May and June US government spending more than doubled[21]. It’s likely some of that money has flowed thorough to people who have used it to play the stock market.
Detached from reality
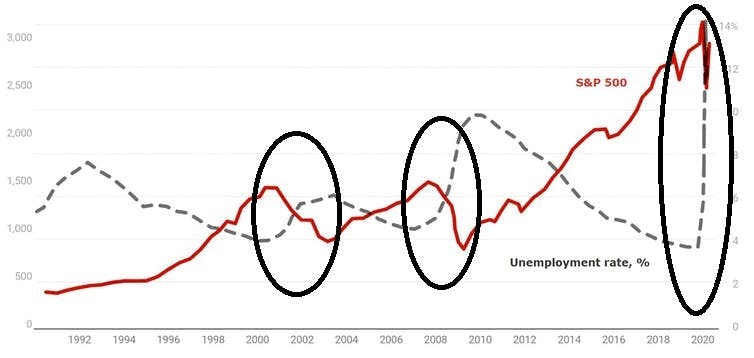
In the past the stock markets have fallen just before unemployment rose, heralding what was to come.
This happened in the US recession at the start of the 2000s and the Great Recession[22] during in the Global Financial Crisis, as the following graph shows.
US unemployment rate and S&P 500
 What’s notable is that the stock market didn’t fall just before unemployment rate climbed this time.
Now, more than ever before, the stock market tells us little about where the economy is heading.
References
- ^ S&P 500 index (www.spglobal.com)
- ^ CC BY-SA (creativecommons.org)
- ^ of more than 10% (www.bloomberg.com)
- ^ Will the GOP let Congress send money to states and cities reeling from the pandemic? 4 essential reads on the economic crisis (theconversation.com)
- ^ CC BY-SA (creativecommons.org)
- ^ Blue-chip, volatile, high-risk: retail investors are buying while professionals are selling (theconversation.com)
- ^ Commodity Markets Outlook (openknowledge.worldbank.org)
- ^ bonds (theconversation.com)
- ^ expectations (theconversation.com)
- ^ 0-0.25% (www.federalreserve.gov)
- ^ 0.25% (www.rba.gov.au)
- ^ in practice (www.rba.gov.au)
- ^ closer to zero (www.rba.gov.au)
- ^ The government has just sold $15 billion of 31-year bonds. But what actually is a bond? (theconversation.com)
- ^ fewer other spending opportunities (theconversation.com)
- ^ boredom markets hypothesis (www.bloomberg.com)
- ^ Paycheck Protection Program (www.sba.gov)
- ^ JobKeeper (budget.gov.au)
- ^ Coronavirus Small and Medium Enterprises Guarantee (treasury.gov.au)
- ^ jumped 11% (www.finance.gov.au)
- ^ more than doubled (www.cbo.gov)
- ^ Great Recession (www.investopedia.com)
Authors: James Doran, Associate professor/Deputy head of school, UNSW


